
Foreign Exchange Trading: 2019 Edition
Every so often, new data provide us a glimpse of parts of the world that few people ever see. Last week, the BIS’s Triennial Central Bank Survey of Foreign Exchange and Over-the-counter (OTC) Derivatives Markets in 2019 provided just such a view. The headline is that average daily foreign exchange (FX) turnover, adjusted for double counting, is $6.6 trillion per day. That is, nearly 8% of global GDP changes hands in FX markets every day! (For a summary, you can listen here.)
Numbers of this magnitude raise a host of questions. In this post, we explore three: First, who is shifting such large volumes of currency around, and what motivates them? Second, history teaches us that disruptions in FX markets can destabilize the broader financial system. Are there signs of emerging risks? Finally, what do we learn about the relative position of the U.S. dollar?
To anticipate our conclusions, the fraction of trading involving nonfinancial entities is relatively small, so the bulk of these transactions (like those in most financial markets) are between intermediaries. In addition, there are hints of growing systemic risk in the FX settlement system, so we need to remain attentive. Finally, no other currency is threatening the dominance of the U.S. dollar—at least, not yet.
Starting with the broad long-run pattern, the BIS notes that “[f]ollowing a dip in 2016, FX trading returned to its upward trend.” In fact, trading rose at an average annual rate of more than 9%—nearly double the growth of global GDP (measured in current U.S. dollars). As the following chart highlights, average daily turnover rose from $1.2 trillion in 2001 to $6.6 trillion in 2019. With the exception of the decline in 2016, the upward trend is clear.
Average daily FX trading volume by counterparty (Billions of U.S. dollars), 2001-2019
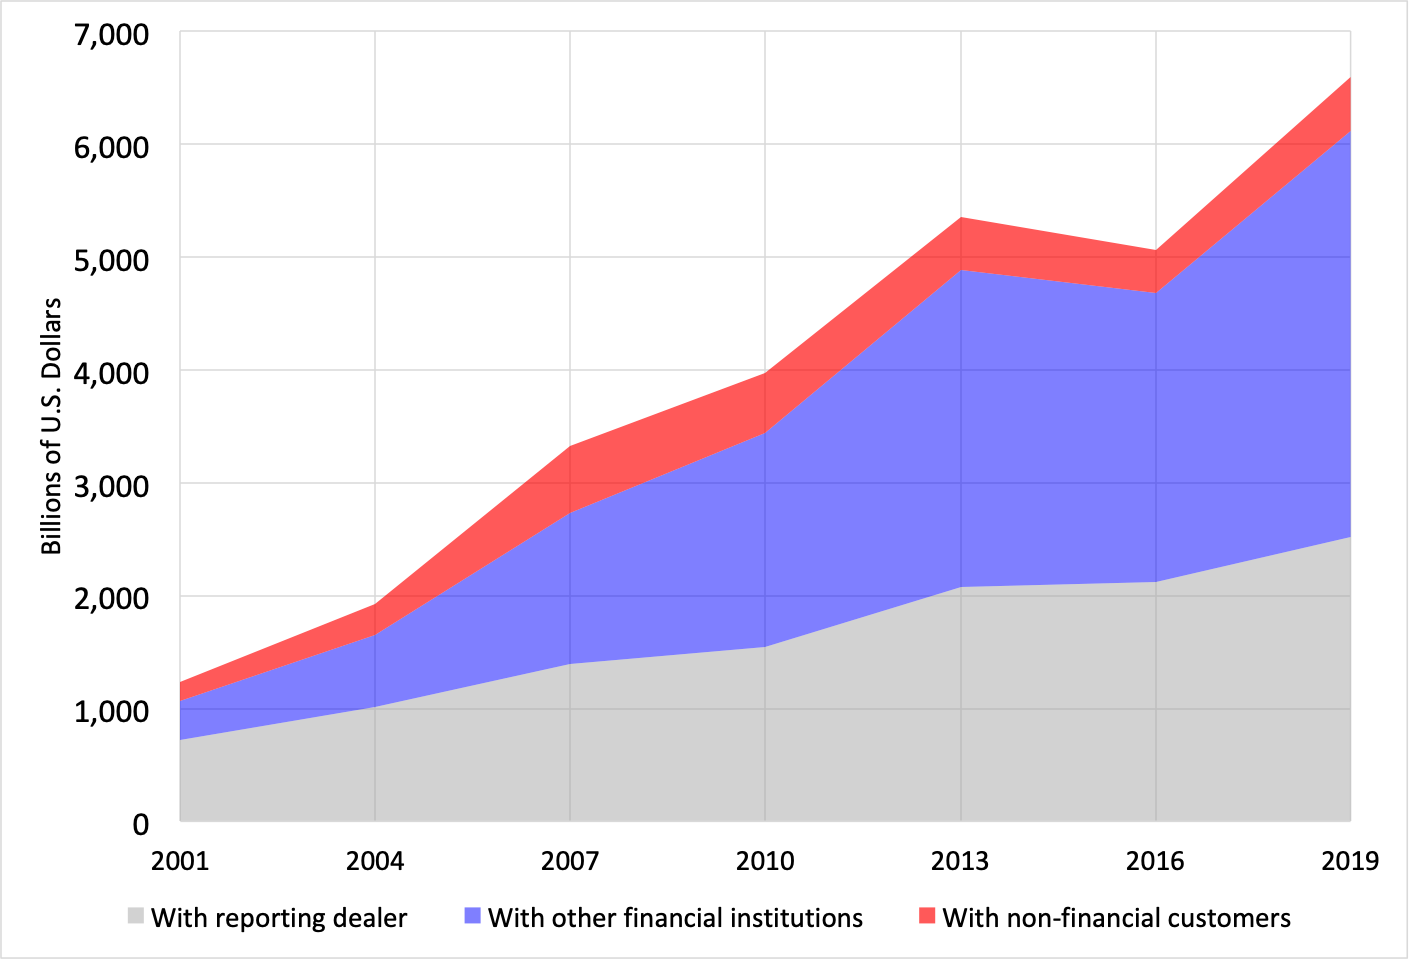
Source: BIS Triennial Survey, 2019.
This brings us to the first question: who is doing all this trading? The chart shows that—as with many financial assets—much of FX trading is between dealers and other intermediaries. The gray area represents the portion that is between two dealers who are among the thousand-plus institutions responding to the survey. In recent years, the intra-dealer share has accounted for roughly 40% of the total. The blue shaded area is the fraction of trading between survey respondents and other financial institutions. This currently accounts for more than half of the volume. Finally, we come to nonfinancial customers, the red area. Here the numbers are more modest―less than 10% of the total. In dollar terms, these final users are involved in less than U.S. $500 billion of FX trades per day. However, annual nonfinancial customer trading of $125 trillion is still about five times global trade flows, and roughly equal to gross international investment positions.
So, while the amounts are enormous, the bulk of FX transactions occurs within the financial system. Put differently, aside from speculation, most of the buying and selling reflects the rebalancing (or hedging) among the intra-financial system participants that results from FX trades with non-financial customers.
Turning to the next question: Is the large and growing volume of transactions creating risks that should worry us? Before answering this question, we need to step back and discuss one of the most important incidents in modern financial history: the failure of Germany’s 35th largest bank, Bankhaus Herstatt, on June 26, 1974. On that day, German supervisors withdrew the bank’s license to operate, after determining that its FX exposure exceeded three times its capital. However, a number of banks around the world had already followed then-standard practice and transferred German currency to Herstatt in Frankfurt with the expectation of receiving U.S. dollars in New York from Herstatt later in the day. Because of the six-hour time difference, Herstatt ceased operation between the time that it received funds and the time that it was scheduled to make payments. The result was chaos in the international banking system. (See here for details.)
The Herstatt failure made everyone in FX markets keenly aware of settlement risk. In response, the largest central banks in the world worked together to create the Continuously Linked Settlement (CLS) Bank. The idea of the CLS bank is two-fold. First, given the large number of transactions (several million per day), CLS can find offsetting transactions. By matching and eliminating what are essentially redundant FX transactions, CLS is able to reduce payments risk and liquidity needs. (We have discussed such trade compression in the context of derivatives more generally, where central counterparties typically provide multilateral netting services (see here).)
Second, CLS requires that all transactions are “payment versus payment” (PvP). We all practice a version of this. When we go to the supermarket, the store requires receipt of payment before we can leave with our groceries. This is “delivery versus payment” (DvP). At CLS, one party delivers currency in exchange for another currency—one payment in exchange for the other payment. Critically, the two things happen at the same time. Markets that do not operate in this way—either the payment lags the delivery or vice versa—can have the problem that arose when Herstatt failed.
In the normal course of our lives, we have a variety of mechanisms for coping with the fact that payment and delivery may not occur simultaneously. For example, in the real estate world, there are escrow accounts where a third party holds the payment until confirmation of title transfer. In some cases, like online purchases, we can get insurance where someone takes responsibility in case one party defaults. And, in yet other instances, repeated transactions and reputation create trust that allows payment and delivery to be asynchronous. The simplest solution, however, is to avoid the Herstatt problem entirely: to do what we do at the supermarket, synchronizing delivery with payment. This is how the CLS bank works. PvP eliminates “Herstatt risk.”
This may sound simple, but it is not. Even though everyone understood the problem, it took from 1974 to 2002, nearly 30 years, to get the CLS Bank up and running. Doing so required the cooperation of all of the central banks whose currencies CLS clears, the creation of accounts (with collateral) for all of the clearing members, and the introduction of a robust technology capable of handling over 1 million payment messages a day (the record is 2.6 million). Originally, CLS cleared transactions among seven currencies: the Australian dollar, the Canadian dollar, the euro, the Japanese Yen, the Swiss Franc, the British pound, and the U.S. dollar. Over the years, they have added 11 more currencies, so that today there are now 18. But, for a transaction to use CLS, both sides must be eligible.
Despite the widening of the CLS-eligible currency basket, FX settlement risk appears to be rising. The BIS data allow us to compute the fraction of daily trading that is not eligible for CLS clearing. The dashed line in the following chart shows that this fraction is growing, from 0.23% of global GDP in 2004 to 1.12% in 2019. In dollar terms, the current CLS-ineligible trading volume is $975 billion, nearly 10 times the $99 billion 15 years earlier. (For a more detailed discussion of how CLS reduces settlement risk, and how that risk may be increasing, see Kos and Levich, and Bech and Holden.) More broadly, Patel and Xia note that FX trading of the currencies of emerging market economies rose from 19% of global turnover in 2016 to almost 25% in the most recent survey.
Shares of FX trading volume by currency (bars) and as a share of world GDP (line), 2001-2019

Source: BIS Triennial Survey, 2019.
Turning to our final question: Is there any evidence of a change in the relative position of the U.S. dollar? Have the euro or the renminbi made any inroads? The short answer is no. In the prior chart, the bars show the fraction of daily turnover accounted for by major currencies over the past 20 years. Since we include both sides of every transaction, the fractions sum to 200%. Looking at the chart, note first that 88% of trades have the U.S. dollar as one side (the blue bar). Meanwhile, since 2001, the euro (red) has dropped from 38% to 32%. And, while the renminbi (yellow) rose from zero to 4%, it remains eighth.
Indeed, on a range of dimensions, dollar dominance persists. For example, looking at the BIS locational banking statistics, and assuming that three-quarters of cross-border positions in euro are inside the euro area (so we should net them out), we see that the U.S. dollar accounts for a stable two-thirds of all cross-border bank liabilities.
There are several likely explanations for the U.S. dollar’s dominance. The first is inertia and the cost of changing, especially in the presence of strong network effects. It is efficient to have one global numeraire, with liquid markets between that particular currency and each of the other 180 or so currencies in the world. To give some sense of how cost-effective this is, consider that if we had a separate market between every currency pair, we would need something like 16,000 markets! The second reason for the dollar’s dominance is the presence of a large U.S. dollar financial market perceived to be relatively low risk. According to one estimate, the U.S. financial system accounts for one-quarter of the roughly $400 trillion that makes up the global system. While the euro area is roughly the same size, euro-area financial markets remain less integrated. Third, related to the last point, investors act as if there is virtually no possibility of the United States curtailing cross-border capital flows: it will always be possible to move funds in and out. Finally, investors view U.S. Treasury securities as the closest thing there is to a risk-free asset.
At this stage, there is no other jurisdiction in the world with the same long history of stability, combined with deep and open capital markets. As Packer, Schrimpf and Sushko suggest, this is surely a big reason that Chinese renminbi turnover remains so low, even as the Chinese economy is poised to eclipse the United States within the next decade (at purchasing power parity, China already is larger).
To conclude, the volume of FX transactions remains enormous and is growing rapidly, albeit primarily among financial intermediaries. As trading shifts away from the currencies of the large advanced economies, settlement systems will need to adjust to ensure safety. Finally, the U.S. dollar seems likely to retain its preeminent position, at least for now. As we have noted on several occasions (here, here and here), the United States reaps substantial benefits from the fact that trade is denominated in dollars and foreigners, both governments and private investors, hold substantial dollar assets. But, in our view, confidence in U.S. policymakers is eroding, while the U.S. economy continues to decline in global importance. Consequently, a rising ability of other governments to deliver liquidity and financial stability poses a real threat to the dollar’s “exorbitant privilege.”