COVID-19 Stress Test
“[The 2019 stress test results] show that our financial system remains resilient [….] The largest and most complex banks […] demonstrated [their] ability to withstand a severe and lasting economic downturn and still be able to lend to households and businesses.” FRB Vice Chair for Supervision Randal K. Quarles, “Stress Testing: A Decade of Continuity and Change”, July 9, 2019
“Banks worked hard to build their capital buffers following the crisis. It is imprudent to reduce the loss absorbing capital at the core of the system at this point in the cycle, when […] payouts have been exceeding earnings.” Statement objecting to change of capital rules, FRB Governor Lael Brainard, March 4, 2020.
The COVID-19 shock is almost surely leading to a larger economic downturn than the Great Financial Crisis of 2007-09. The OECD estimates that the initial hits to activity from the partial shutdowns in advanced economies range from 20 to 25 percent, with the impact on annual GDP growth depending on how long the necessary activity restrictions remain in place. Even with the unprecedented fiscal and monetary stimulus efforts under way, the extraordinary loss of income and jobs will diminish the ability of households and firms to meet their financial obligations. A wave of bankruptcies could have lingering impact on aggregate demand while testing the resilience of financial systems everywhere.
However valuable, neither stress tests nor financial supervision in general has prepared us for a shock of this magnitude. For example, the severely adverse scenario for the Fed’s 2020 stress tests assumes that the unemployment rate rises from its February 2020 level of 3.5 percent to a peak of 10 percent six quarters later. However, many private forecasters now anticipate that the U.S. unemployment rate could hit double digits within 2020. At the same time, since 2017, the Federal Reserve has acted as if the largest banks’ capital buffers were bigger than necessary, allowing increases in capital distributions and a growing reliance on debt finance. Consequently, regulatory leverage ratios of both the global systemically important banks (G-SIBs) and other large U.S. banking organizations (LBOs) have been declining (see the Federal Reserve Bank of Kansas City’s Bank Capital Trend Analysis).
These developments leave us profoundly concerned that the global financial system lacks the resilience needed to weather what will clearly be a very violent storm. Do banks have sufficient capital to withstand the economic and financial shock from the unavoidable effects of COVID-19 on behavior and on policy? Will turmoil once again prompt liability holders to run, triggering asset fire sales, and compelling central banks (once again) to do whatever it takes to avert a meltdown? In some markets—like those for U.S. debt and equities—investors already are anticipating a very rough ride (see here and here).
In our view, the most up-to-date information regarding the impact on the financial system of COVID-19 comes from NYU Stern Volatility Lab’s SRISK. By utilizing timely weekly market equity data, rather than less accurate and substantially delayed book-value information, SRISK enables us to gauge the aggregate shortfall of capital in the financial system during a crisis (defined as a 40 percent drop of the global equity market over the next six months). Analogous to a severe stress test, the idea behind SRISK is that an intermediary contributes to fragility to the extent that it is short of capital at the same time that there is a system-wide shortfall (see, for example, here). Just as a forest is more vulnerable to fire during a drought, so the financial system is more vulnerable to a large shock when there is a large aggregate capital shortfall. (It is worth noting that a 40-percent global equity market drop from the March 27 close would result in an overall peak-to-trough decline that is similar to the 55-percent plunge from October 2007 to February 2009.)
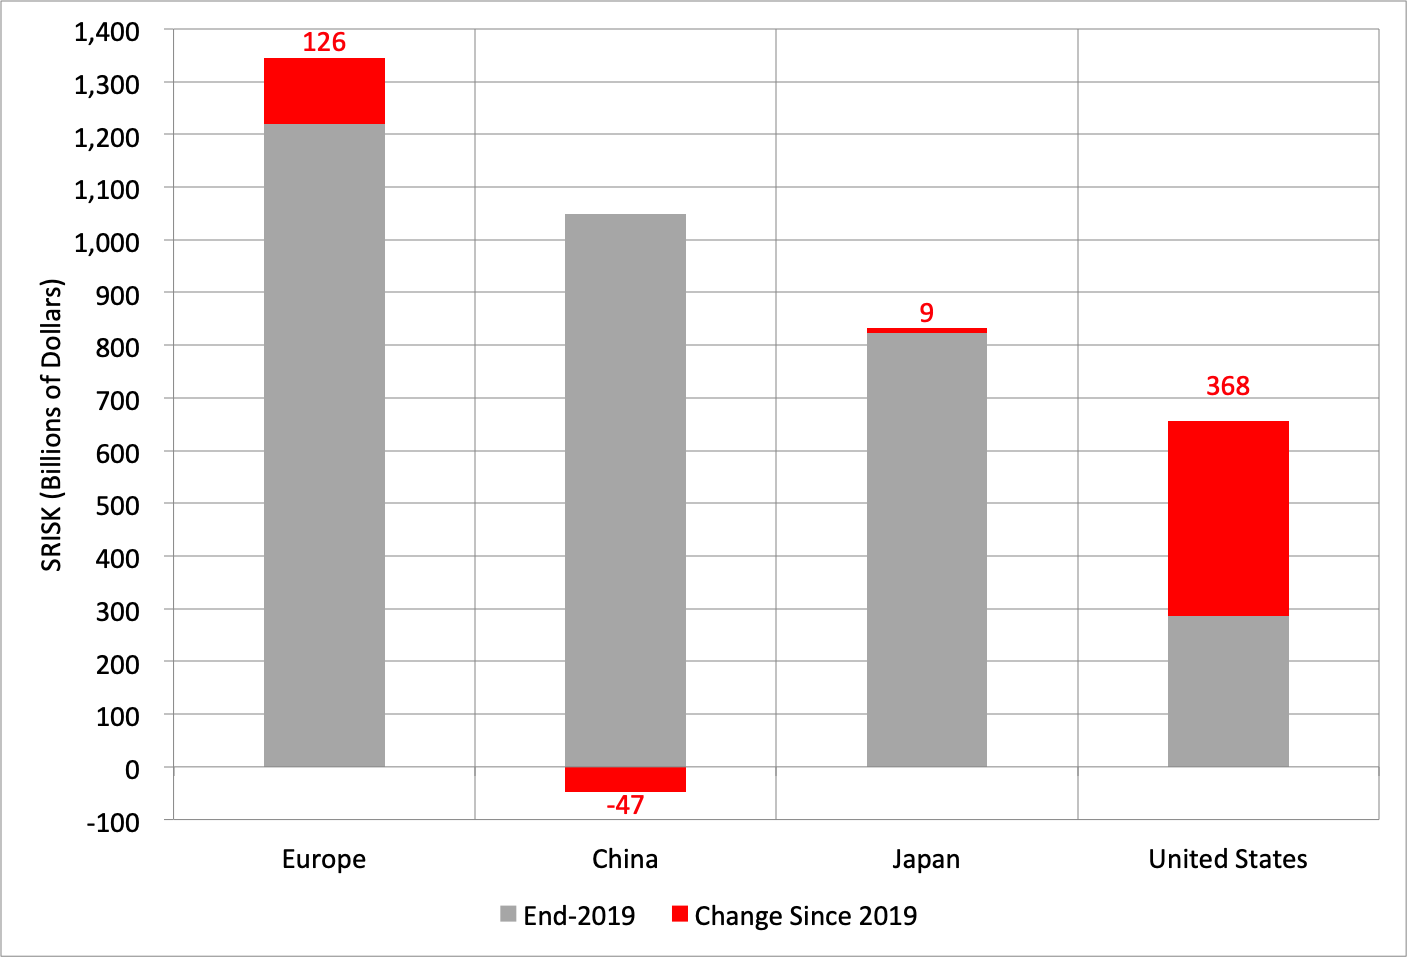
So, what does SRISK tell us about the state of financial resilience before and after the impact of COVID-19? First, in the run-up to the crisis, aggregate SRISK was elevated in Europe, China and Japan (see chart). Second, in the 12 weeks since the end of 2019, U.S. system-wide SRISK has more than doubled; an increase that far exceeds the changes elsewhere (see red portion of bar in chart).
SRISK by region (Billions of U.S. dollars), March 27, 2020 versus December 31, 2019
Note: Numerical SRISK changes shown in red next to red bar. Source: NYU Stern Volatility Lab using the global dynamic MES model of world financials with standard assumptions (40 percent global equity drop; 40% of “separate accounts” of insurers included; and equal-weighted capital requirements of 5.5 percent for Europe and 8 percent elsewhere).
In the remainder of this post, we highlight some recent SRISK developments and compare them to those during the 2007-09 crisis.
Before proceeding, it is important to understand why SRISK uses equity market values rather than equity book values to assess the capital adequacy of financial intermediaries. In valuing equities, investors seek to incorporate their views of likely future developments. This forward-looking behavior is in contrast with standard accounting measures that can lag substantially in their treatment of delinquencies and bankruptcies when assessing the value of intermediaries’ assets. Moreover, as mentioned, equity market values are available in real time, while accounting disclosures typically occur quarterly and with a lag.
So, what are SRISK’s key features today?
First, high current levels of SRISK are by definition associated with high reliance on debt. Looking back at the previous chart, we would expect Europe’s banks to have a much greater reliance on debt (relative to equity) than those elsewhere. Indeed, comparing European and United States banks with positive SRISK, we see that the weighted average leverage ratio (the ratio of the sum of market equity and fixed liabilities to market equity, all weighted by fixed liabilities) in Europe is nearly 48, three times what it is in the United States. In the early years of Fed stress testing—from 2010 to 2016—U.S. banks made substantial progress in reducing reliance on debt and building equity buffers. By comparison, European intermediaries lagged: as a result, the regulatory leverage ratios of European G-SIBs averaged about 4.8 percent in mid-2019, compared to 6.7 percent for U.S. G-SIBs (see here).
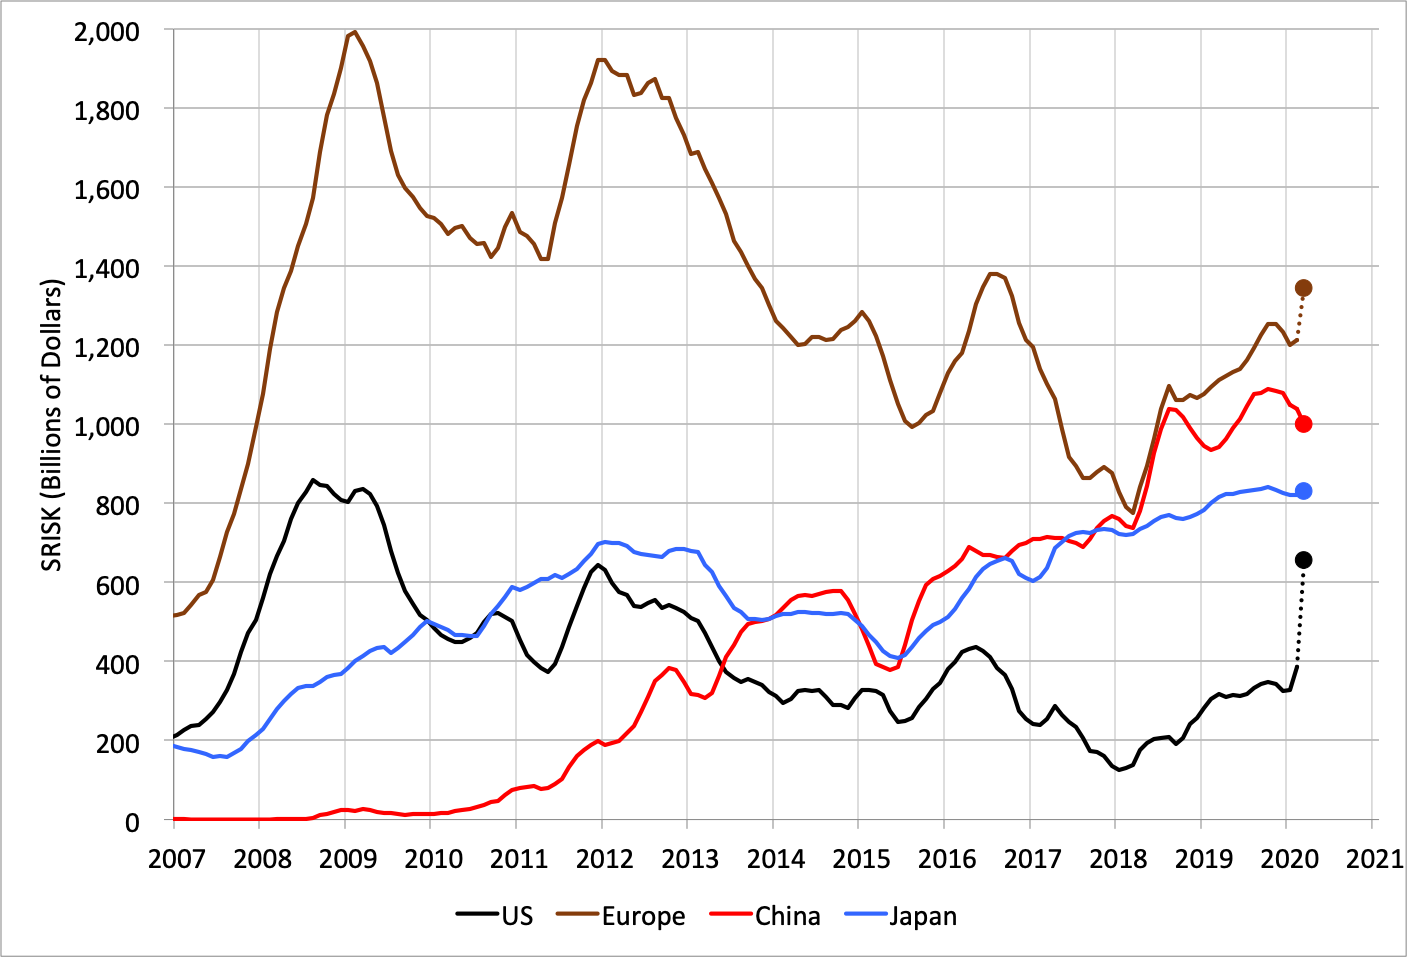
Second, while SRISK in the United States and Europe peaked in the crisis of 2007-09 (see black and brown lines in the next chart), in China and Japan, it has been drifting higher, and is now close to peaks in both economies (see red and blue lines).
SRISK by region (Billions of U.S. dollars, end-month), January 2007 to March 27, 2020
Source: Data history provided by NYU Stern Volatility Lab. March 27, 2020 observation from Volatility Lab website and authors’ calculations. All data use the global dynamic MES model of world financials with default assumptions (40 percent global equity drop; 40% of “separate accounts” of insurers included; and capital requirements of 5.5 percent for Europe and 8 percent elsewhere). With the exception of the final data point for March 27, 2020, we plot the five-month centered moving average.
Third, as mentioned, COVID-19 appears to be having by far the largest impact on the resilience of U.S. intermediaries. Not only has aggregate U.S. SRISK more than doubled over the past three months (see first chart above), but even after the March 27 enactment of the largest countercyclical fiscal spending package in U.S. history, it has reached its highest level since 2009 (see black dot in chart above).
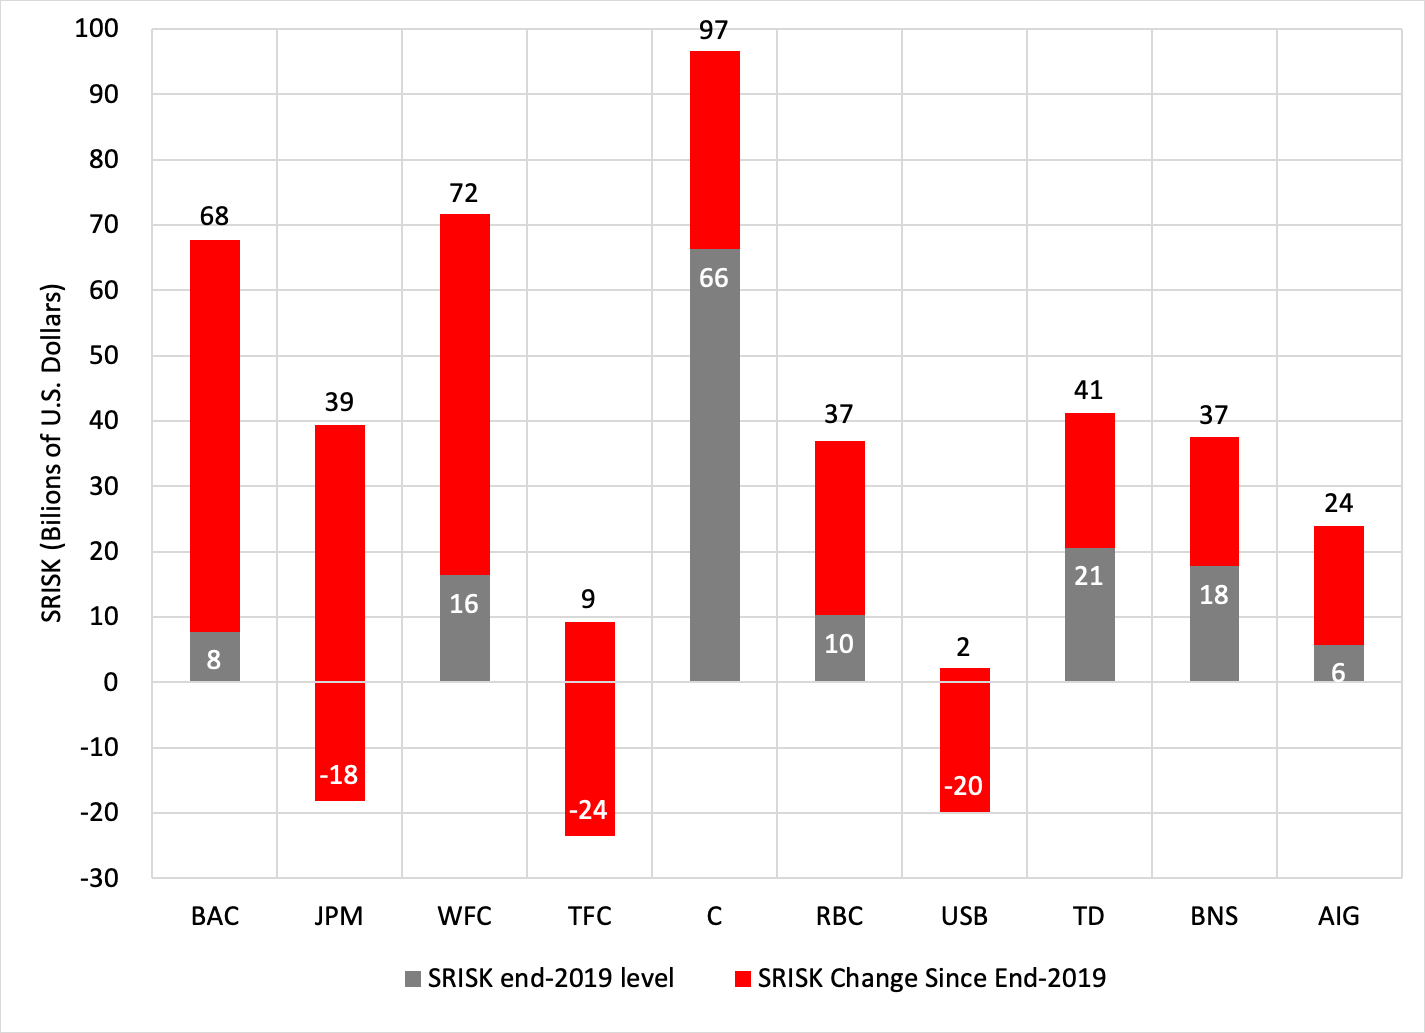
A closer look at individual intermediaries highlights the impact of COVID-19 on the United States’ financial system. First, for those with positive SRISK, we rank firms in Asia, Europe and North America by their change in SRISK since the end of 2019. On this basis, the top five institutions, and seven of the top 10, are in the United States (see the following chart). Second, more than 90 percent of the collective increase in SRISK reflects the loss of equity market value (rather than a change in debt or in risk). Finally, more than 80 percent of these firms’ current SRISK (the numbers in black above the bars in the chart) reflects the increase since the end of last year.
Top 10 Intermediaries Ranked by SRISK change, March 27, 2020 versus December 31, 2019
Notes: We rank firms by the changes in SRISK (red bars) from December 31, 2019 to March 27, 2020. Gray bars and white numbers are the levels of SRISK at the end of 2019, while black numbers are the levels of SRISK as of March 27, 2020. Firms with negative SRISK at the end of 2019 have no gray bar. BAC: Bank of America. JPM: JP Morgan. WFC: Wells Fargo. TFC: Truist Financial. C: Citigroup. RBC: Royal Bank of Canada. USB: U.S. Bank. TD: Toronto-Dominion. BNS: Bank of Nova Scotia. AIG: American International Group. Source: NYU Stern Volatility Lab using the global dynamic MES model of world financials with default assumptions (40 percent global equity drop; 40% of “separate accounts” of insurers included; and capital requirements of 8 percent).
We see this weakness (or severe deterioration) of banks’ capital positions as a clear warning to regulators and supervisors that the COVID-19 shock meaningfully threatens financial stability across all major jurisdictions. Importantly, this includes the United States, where (until 2017) firms had made substantial progress in building capital buffers. As a consequence, we share the view expressed by the Systemic Risk Council that financial intermediaries should cease capital distributions (stock buybacks and dividends). The ECB has asked Eurosystem banks to do so, and other supervisors should follow suit―legally requiring it, if necessary.
We are especially dispirited that, as recently as four weeks ago, Federal Reserve Board Governor Lael Brainard was unable to convince her colleagues that regulatory changes reducing capital requirements for large banks were imprudent (see opening quote). Following Governor Brainard’s lead, we urge supervisors to beef up stress tests and to strengthen capital planning regimes for the largest, most complex, and most interconnected intermediaries. If, as one expects, future “severely adverse” scenarios include the experience of the COVID-19 episode, some increased stringency will occur automatically. However, we continue to believe that large intermediaries’ capital buffers are seriously inadequate. Creating sufficient resilience to guard against even a moderate financial crisis (much less the tidal wave of COVID 19) requires a further substantial increase in the level of capital requirements in every major jurisdiction (see our earlier posts here and here).
The passage of time only makes regulatory and supervisory complacency more, not less, scandalous.
Acknowledgments: We thank the NYU Stern Volatility Lab for providing the data in this post.


