Stagflation, n. Blend of stag- (stagnation) and -flation (inflation). A state of the economy in which stagnant demand is accompanied by severe inflation. Oxford English Dictionary.
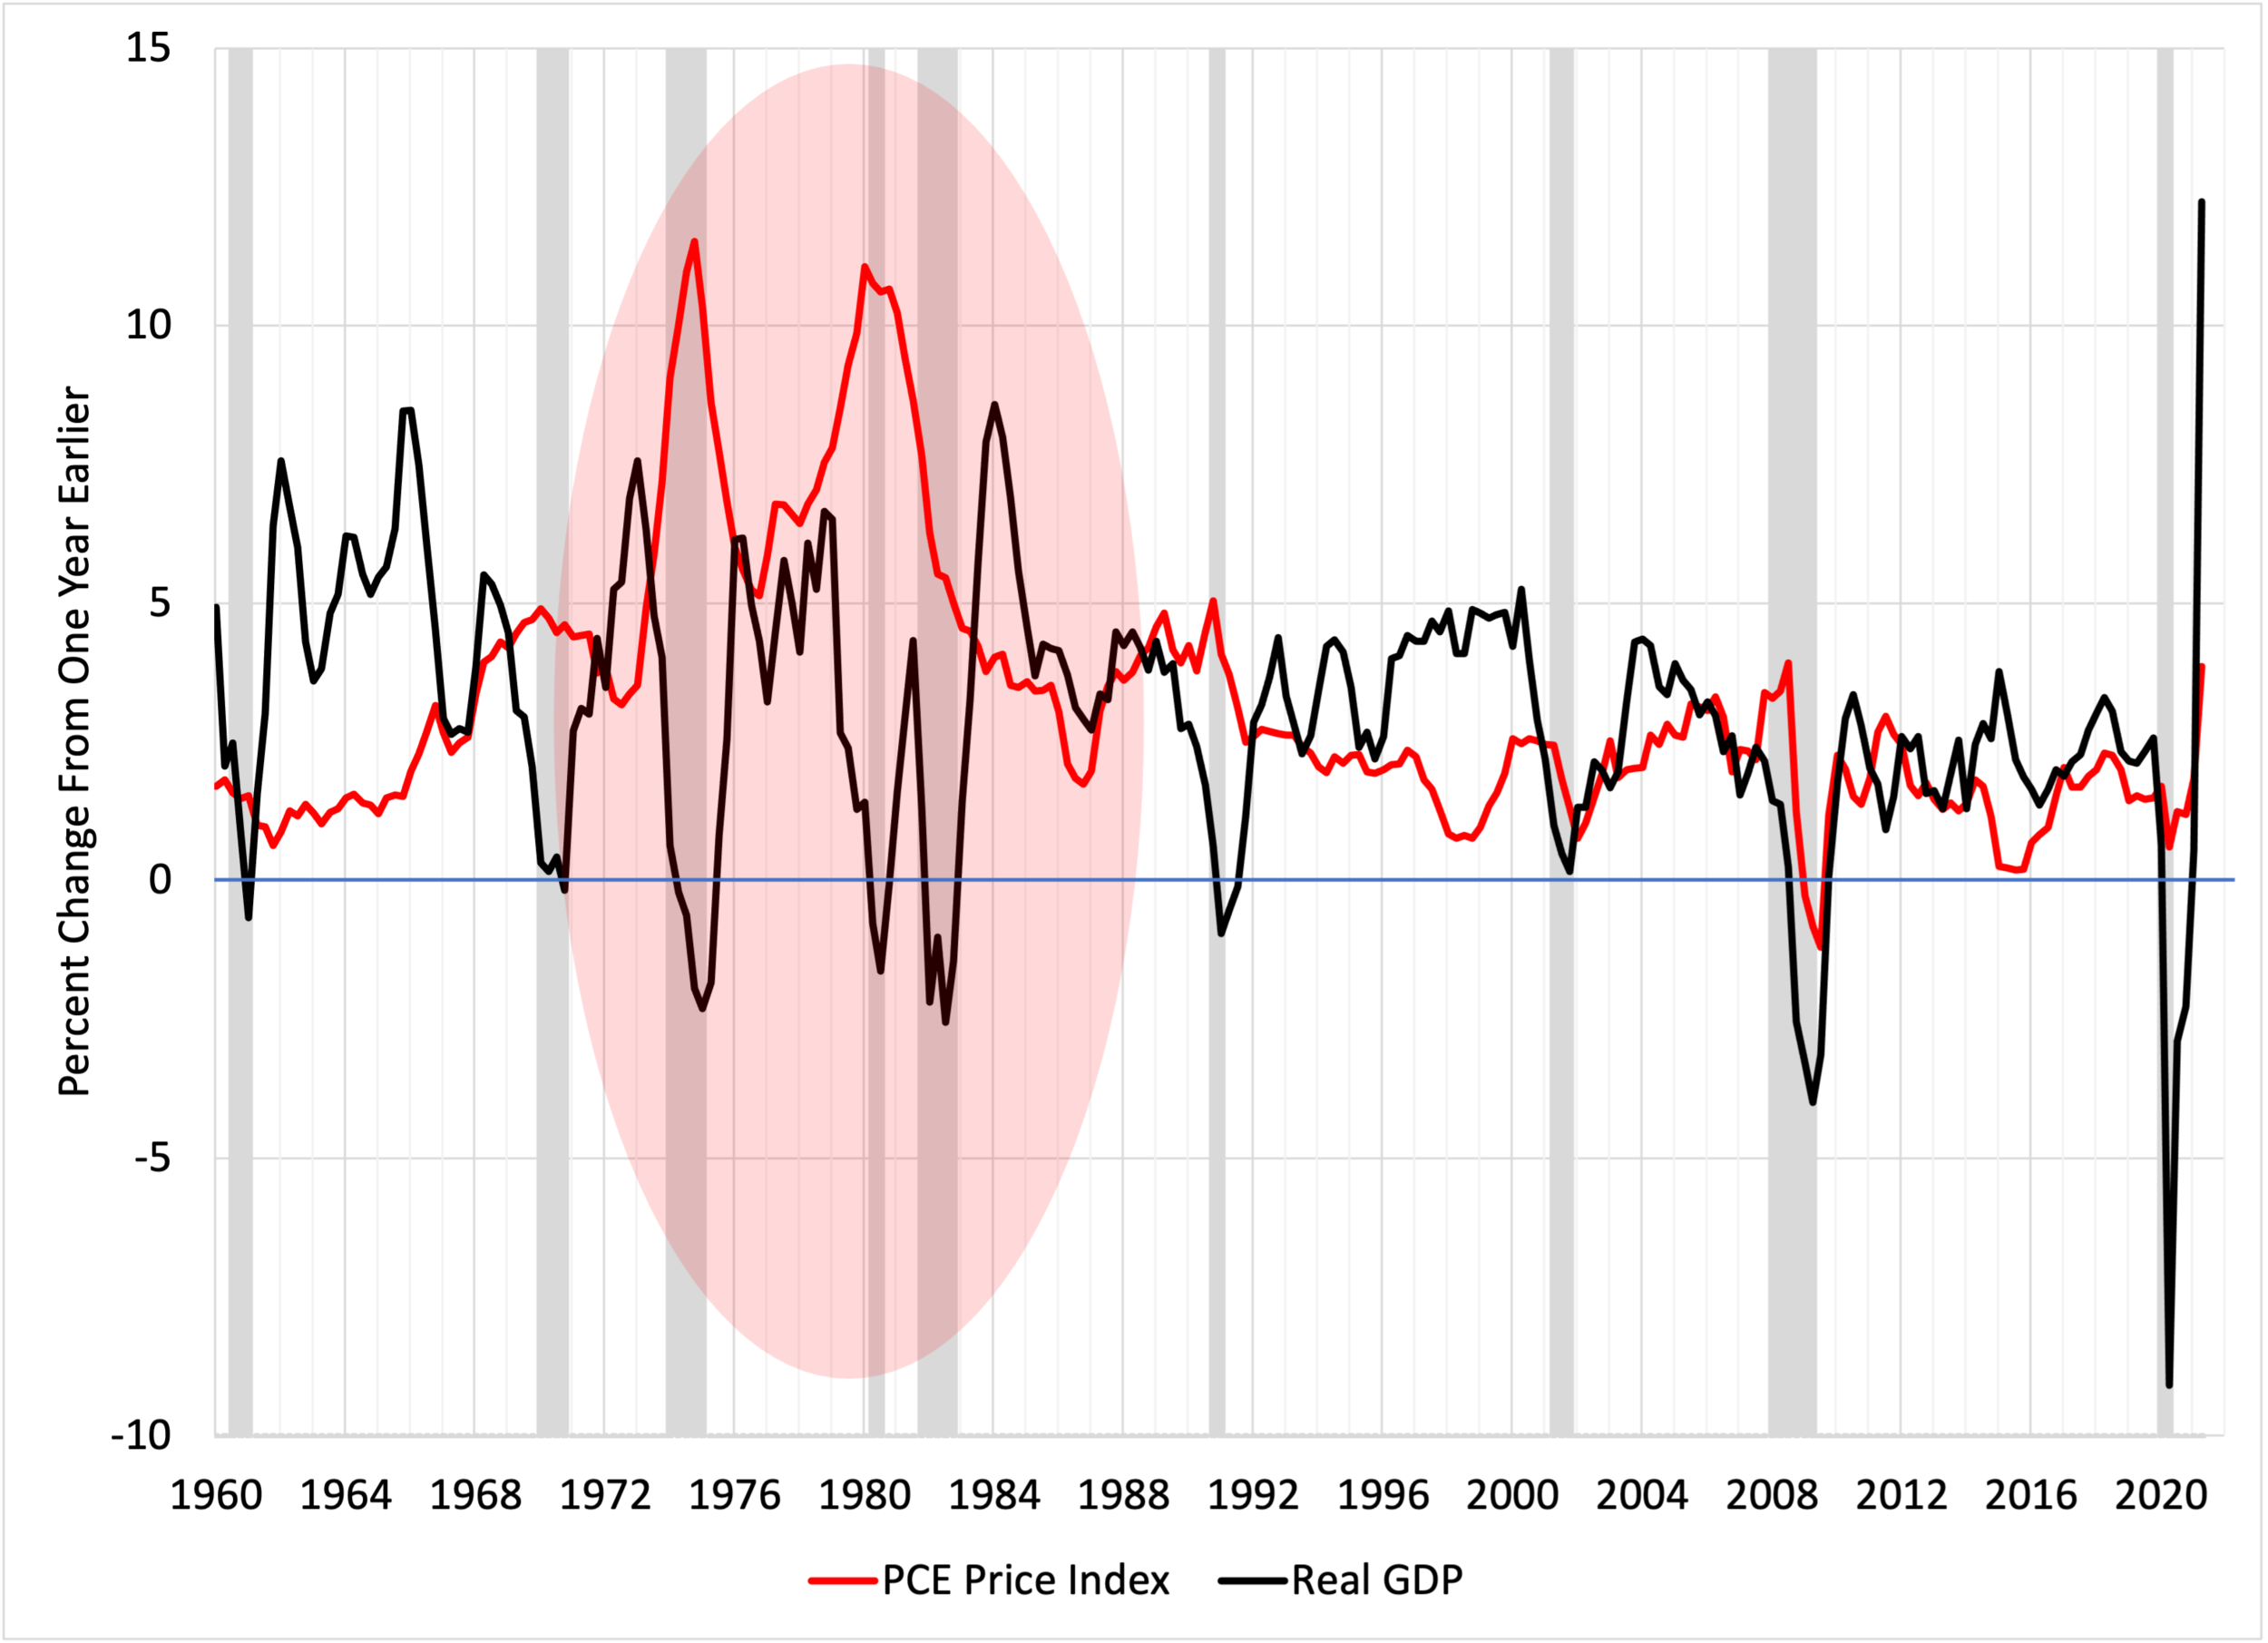
The term stagflation came into common use in the mid-1970s. Compared with their healthy performance in the 1960s, many advanced economies experienced higher inflation and slower growth. For example, in the United States, inflation rose from 2.8% in the 1960s to 7.8% in the 1970s, while real growth fell from 4.1% to 3.2% (see chart). Similarly, French inflation rose by six percentage points and growth fell by two. And in Italy, inflation surged by 10 percentage points, while growth slowed from an average of 5.7% to 3.8%.
United States: Annual change of the price index of personal consumption expenditures (PCE) and real GDP (Percent), 1960-2Q 2021
At the time, the joint behavior of inflation and economic growth confused many economists. Throughout the 1950s and 1960s, growth and inflation generally moved in the same direction. Most important, inflation tended to fall during recessions and to rise in booms. Stagflation meant that these two key summary measures of macroeconomic performance moved in opposite directions. What caused this dramatic, painful, and persistent shift?
To understand the sources of stagflation in the 1970s—and how we subsequently avoided a repeat of that episode (at least so far)—we start with the simple premise that there are two types of disturbances hitting the economy: demand and supply. The first, changes in demand, moves inflation and growth in the same direction. The broad array of things that shift demand include fluctuations in consumer or business confidence, shifts in government tax and expenditure policy, and variation in the appeal of imports to domestic residents or of exports to foreigners. When any of these goes up or down, inflation and output rise and fall together.
Supply disturbances—which alter the cost of production—are fundamentally different. These stagflationary shocks move growth and inflation in opposite directions. For example, an adverse supply shock that raises the cost of production at least temporarily drives inflation up and growth down, consistent with developments in the 1970s. Such adverse shocks can come either from outside a country’s borders or emerge internally. People often point to the 1973-74 OPEC oil embargo as an example of the former. By limiting the availability of oil to economies around the world, suppliers drove prices up by a factor of four. Since oil was a critical source of energy without ready short-run substitutes, economic activity fell sharply as inflation rose. (As an aside, some observers consider the 1970s oil shocks as an endogenous response to a prior long period of excessive aggregate demand: see Barsky and Kilian.)
More recently, the pandemic-induced decline in the willingness of workers to provide in-person services is an example of a domestically generated adverse supply shock. Other examples include wars that destroy physical capital (including buildings and equipment) or reduce the availability of skilled workers; and regulatory actions that restrict supply, such as limitations on land use, obstacles to cross-border trade, or licensing requirements.
In practice, economic disturbances frequently combine both demand and supply shocks, making it difficult to discern whether they will be inflation or disinflationary. A prime example is the August 1990 Iraqi invasion of Kuwait that triggered both an increase in the price of oil (supply) and a plunge in U.S. business confidence (demand). In the end, the price impact of these shocks roughly balanced, so as the U.S. economy weakened, the net impact on inflation was modest.
That said, we can still use the evolution of inflation during recessions as a rough guide to whether they are primarily driven by demand or supply. The following table shows dates of the nine U.S. recessions since 1960, along with the change in 12-month inflation from the cyclical peak to trough as measured by the price index of personal consumption expenditures (PCE). Note that in seven cases inflation fell; in one (1980) it remained constant; and in only one (the 1973-75 recession that followed the oil embargo) did it rise. Strikingly, inflation fell in the three recessions since 2000.
Inflation during recessions, 1960 to 2021
Unless producers absorb all the effects through a sustained decline of profit, increases in costs and declines in productive capacity drive prices up. But a one-shot price increase is critically different from a sustained increase in inflation. So, looking at the stagflation of the 1970s, we know that cost shocks cannot be the whole story behind the decadal surge of inflation. Whether the consequences are one-off adjustments in the price level or an increase of the trend of inflation depends on the monetary policy response. Put differently, monetary policy determines whether we experience stagflation over any longer interval.
Thus, during the 1970s, the central bank failed to prevent aggregate demand from outpacing the slowdown in the growth of aggregate supply. During the 1973-74 recession, for example, demand did not fall as far as output; during the recovery, persistently excessive demand growth fueled a rise of trend inflation.
To restore stable, low inflation during the 1970s, the U.S. central bank (and others) would have needed to tighten monetary policy more than it did. Instead, policy rates averaged well below what a simple Taylor rule that aims at price stability would have prescribed. This policy hesitation likely reflected the belief (subsequently confirmed) that the cost of keeping inflation low would have come in the form of significantly higher unemployment for some time.
Eventually, however, when inflation again reached double-digit levels in the late 1970s. a political consensus began to emerge that the central bank should aim to restore price stability. With the appointment of Paul Volcker as the Chairman of the Board of Governors of the Federal Reserve in August 1979, monetary policy tightened sharply. In early 1981, policy rates peaked at a previously unimaginable 19%. Over the following two years, as the unemployment rate rose to a then post-WWII high of 10.8%, inflation fell to 4%. (To put this into perspective, from 1995 to 2019 the policy rate never surpassed 6.5%, 12-month PCE price inflation never exceeded 5.6%, and the unemployment rate peaked at 10% in the depth of the 2007-09 financial crisis.)
The stagflation of the 1970s, combined with the subsequent high social cost associated with driving inflation down to acceptable levels, led many central banks to introduce an inflation targeting strategy that focuses on price stability. As a result, despite the continued presence of adverse supply shocks after 1990, trend inflation remained low and stable (at least until recently). To take just one example, in 2008, the oil price more than doubled in inflation-adjusted terms—a jump similar in magnitude to the one in 1973—but the rise in U.S. economywide inflation was both smaller than in the 1970s and transitory (see the previous chart).
The difference in the monetary regimes is surely one important reason for the favorable change in inflation dynamics, both in the United States and in other inflation-targeting countries. Put simply, in the 1970s people did not generally believe that the Fed was committed to keeping low and stable while in the 2000s they did. By keeping inflation low from 1990 to 2020, policymakers made their commitment to price stability credible. As a result, even in the presence of adverse supply shocks, people expect trend inflation to remain low, so it does.
The history of the past half century teaches us the lesson that central banks do ultimately control the trend of inflation and can prevent episodes of stagflation. Looking forward, we can ask whether they will always do so. Are there circumstances when policymakers will allow adverse supply shocks to turn temporary rises in inflation into enduring ones?
We can envision two sets of circumstances when central bankers, even those that experienced the painful lessons of the 1970s, might act in ways that create stagflation. First, as we mentioned earlier, economic disturbances often incorporate both supply and demand shocks, so it may be difficult to figure out the net impact, especially as it changes over time. Calibrating the policy response also involves considerable uncertainty, in part because monetary policy affects economic activity and inflation with different (and varying) magnitude and timing.
The case of the pandemic is a clear example of this problem of “shock recognition and policy adjustment.” As broad swaths of the economy shut down and many people shifted to remote work, the initial response was a decline in inflation (see the previous table), suggesting that the decline in demand exceeded the fall in supply. But, following massive fiscal and monetary policy stimulus and the availability of vaccines, aggregate demand recovered rapidly, even for in-person services. Consequently, in 2021, problems with supply chains and local labor shortages became the dominant force. Their net impact is to increase costs, driving up prices and—at least temporarily—measured inflation. If demand outpaces supply for longer and by more than policymakers foresee, the increase in inflation could become persistent.
Since policymakers learn from experience, the problems with shock recognition and policy adjustment ought not persist for too long. However, the second reason that policymakers might allow inflation to rise is more political than economic, and is likely to be more sustained: namely, they may lack the will to impose the necessary short-run costs on the economy. In the face of an adverse supply shock, keeping inflation low may require engineering a deep downturn, like the Volcker recession of the early 1980s. Even with broad public support, this is difficult and requires unusual policy resolve.
Is there public support amid the pandemic for keeping U.S. inflation low if the cost is an economic slowdown or recession? Keep in mind that someone who became an adult in the past 30 years (that, is nearly half of the adult U.S. population) has never experienced average inflation of even 4% for a single calendar year. If inflation remains stubbornly above the Federal Reserve’s 2% longer-term goal, will people support tighter monetary policy? Or, will they view the long-term benefit of low trend inflation as speculative? Over time, democracies usually get the economic policies that their citizens favor. Without political backing, central bankers may find it difficult to impose the costs necessary to avoid stagflation.
Our conclusion is simple. Persistent stagflation is a problem central banks know how to prevent. While they cannot keep adverse supply disturbances from driving growth down and raising prices temporarily, they can prevent transitory increases in inflation from becoming permanent.
The key is that the public believes in monetary policymakers’ commitment to price stability and supports necessary monetary policy restraint even when the short-run costs may be high.


